2022-06-05 06:31

Image: Shutterstock
Reviewing some of the producers of conflict event datasets and their specialties helps narrow the search. Following are thumbnail sketches of three large-scale data-collection projects often cited in media reports and scholarly studies. Also included are examples of how the media use these datasets to report on armed conflict and how these groups collaborate.
Uppsala Conflict Data Program (UCDP): Datasets on conflict and peacekeeping including peace agreements, intrastate armed conflict, non-state conflict, one-sided violence, and conflict termination. UCDP offers datasets on organized violence and peacemaking, which can be downloaded for free through the UCDP downloads website. Illustrative charts, graphs, and maps are also available.
Armed Conflict Location & Event Dataset (ACLED): Described as disaggregated data collection, analysis, and crisis mapping platform. Collects real-time data on the locations, dates, actors, fatalities, and types of all reported political violence and protest events across the globe. Users can explore data with an interactive dashboard. Operates under the slogan, “Bringing clarity to crisis.”
Peace Research Institute, Oslo (PRIO): Explores how conflicts erupt and can be resolved; investigates how different kinds of violence affect people and examines how societies tackle crises. Data projects include collecting conflict start and end dates to aid in the study of the duration of violence and adding figures for yearly combat deaths. Active research projects are listed alphabetically and include dozens of topics.
The data these groups collect is impressive and, at times, daunting. How does it translate into real-world news reporting? What kind of stories does it help to tell?
“Journalists equipped with data and empirics have a very powerful instrument to enlighten, but also to ask decision-makers the right questions,” said PRIO’s Tollefsen, a self-described human geographer. “Looking at data often challenges narratives or generates inquiries that wouldn’t be evident without it.”
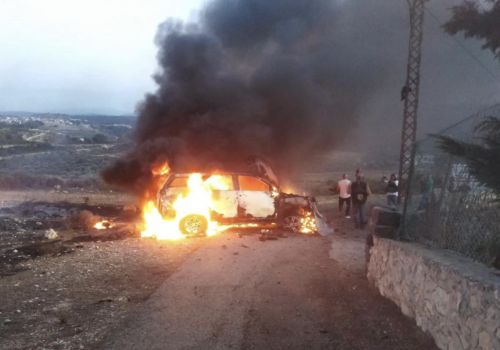
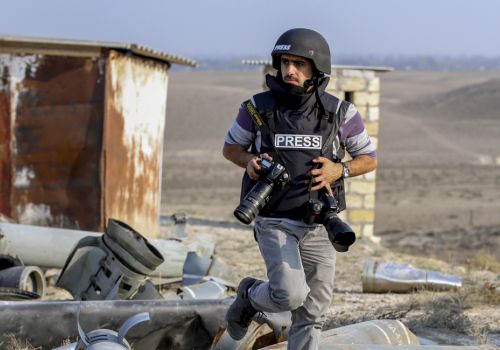
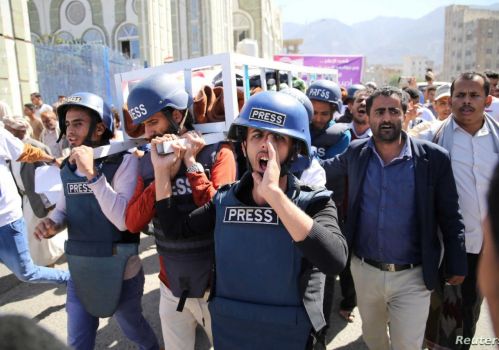
For instance, data can show trends, maps, and patterns, highlighting whether violence has gone up or down in a region, where conflict is located, and how this relates to conditions on the ground that impacts civilians, such as migration or refugees. A story based on ACLED data showed how conflict in northern Mozambique displaced over half a million people.
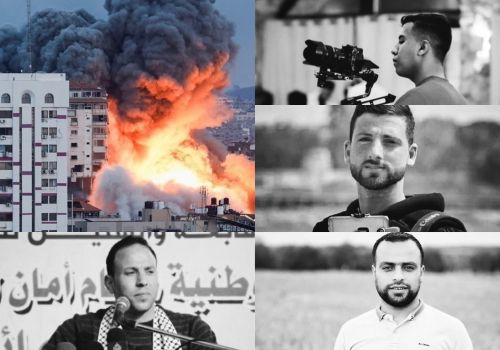
PRIO’s data was used in combination with other sources in a recent Save the Children report, “Weapons of War: Sexual violence against children in conflict.” Statistics showed that nearly 10 times more children are at risk now than three decades ago when the toll was 8.5 million.

Image: Courtesy of Save the Children
Syria, Colombia, Iraq, Somalia, South Sudan, and Yemen were identified as countries where children are at greatest risk of sexual violence, including rape, sexual slavery, forced prostitution and pregnancy, sexual mutilation, and sexual torture at the hands of armed groups, government forces, and law enforcement.
“Data is a powerful tool and challenges our understanding of the world,” said Tollefsen, whose work focuses on the use of geospatial data and Geographic Information Systems for research on the cause and consequences of conflict.
In another collaborative effort, PRIO examined trends in Middle East conflicts between 1989 – 2019 and compared them to global trends, using UCDP data. Researchers analyzed conflict recurrence, ceasefires, and peace agreements during the same period.
The study found that over the past 10 years, the majority of the world’s deadliest conflicts have been in the Middle East, with Syria being the deadliest. Data also plays a pivotal role in breaking news, such as the impact of COVID-19. As the pandemic spread, data journalism provided vital, reliable information through the use of interactive maps, graphics, and charts marking cases and deaths.
The Washington Post used ACLED data to explore: “Does COVID-19 raise the risk of violent conflict?” The number of conflict events was tracked over time to see whether trends changed after the World Health Organization declared a global pandemic in March 2020, or the country declared lockdown.
In the story, the Post defined ACLED as “a database that counts the number of conflict events daily around the world. For 2019 and 2020, ACLED includes more than 100 countries in Africa, Asia, Latin America, and Eastern Europe — and tracks three categories of violent conflict: battles, violence against civilians, and explosions/remote violence.”
A June 2020 article that appeared in South Africa’s Mail & Guardian examined how the pandemic had shifted patterns of conduct in Africa.
“Tracking activity over the past 10 weeks, ACLED found that conflict rates held steady across the continent, but patterns of violence have shifted as armed groups and governments take advantage of the pandemic to make moves on political priorities,” wrote ACLED’s director, Clionadh Raleigh.
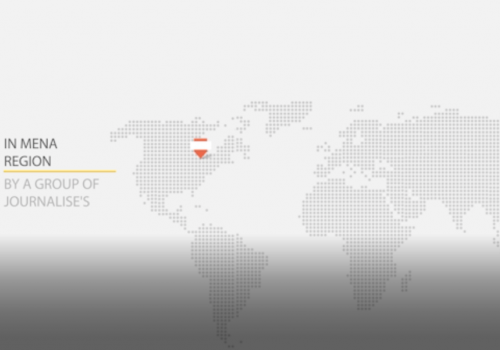
A detailed infographic accompanied her story. Finding appropriate sources of conflict data is the first step. Interpreting the information correctly can be challenging. Following are tips from experts on how to analyze and evaluate research for accuracy, reliability, and fairness, the hallmarks of quality reporting.

South Africa’s Mail & Guardian used data to create an infographic from ACLED to track the early stages of the COVID-19 pandemic and its impact on conflict within the continent. Image: Screenshot
Harvard University research fellow Kelly M. Greenhill co-authored a book “Sex, Drugs, and Body Counts: The Politics of Numbers in Global Crime and Conflict” exploring the misuse of conflict statistics and showing that miscalculations can have “perverse and counterproductive consequences.”
Getting it wrong might, for instance, help prolong wars, give governments an excuse not to act, or muddy evaluations of policy successes or failures in conflict zones.
What can journalists do to get it right? Greenhill provided the following questions that should be routinely asked about crime and conflict data:
“To some degree, the politicization of statistics is inevitable and unavoidable. But journalists as consumers and disseminators of statistics should be more savvy and credulous in their acquisition and utilization of these data,” said Greenhill, a political science and international relations professor at Tufts University.
She is concerned journalists could inadvertently serve as amplifiers of politically motivated statistical distortions leading to “counterproductive policy outcomes.”
Greenhill has been a consultant to the World Bank, UN High Commissioner on Refugees, and an analyst for the US Department of Defense. She is working on a new book exploring the influence of rumors, conspiracy theories, propaganda, so-called “fake news,” and other forms of extra-factual information on international politics.
Assessing similarities and differences in datasets is another way to evaluate how useful they might be for conflict coverage.
Roudabeh Kishi, ACLED’s director of research and innovation, co-authored a report comparing conflict data from several well-known sources, including the Global Terrorism Database (GTD), Integrated Crisis Early Warning System (ICEWS), the Phoenix event dataset, and Uppsala Conflict Data Programme Georeferenced Event Dataset (UCDP GED).
The stated purpose of the study: “To demonstrate how the collection [of event data] mandates, coding rules, and sourcing methods can result in drastically different information on political violence and interpretations of conflict.” Researchers also looked at human-generated data versus automated.
What should journalists look for? Among indicators on the veracity of data, the report listed:
“Some people say,’Well, data is data and that’s it.’ It’s important to remember these are different projects with different methodologies, definitions, and usually based on a specific mandate,” Kishi explained. “Pay attention to what sources the datasets are using. That makes a really big difference.”
She advises beginners to learn simple software such as Tableau, an analytic tool that can help in the creation of maps and charts or filter by actors or by violence. There is a training video on ACLED’s website.
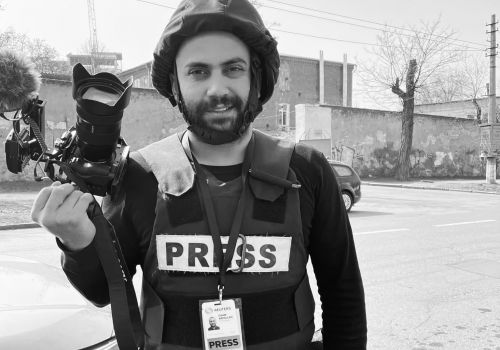
Since its beginning in 2011, the group has amassed a vast archive of eyewitnesses’ names, contact information, and testimonies, as well as the photos and videos that are meticulously preserved as background for scholarly research, use in news stories, or for future war crimes trials.
“Supplying statistics to media is part of our advocacy,” said Fadel Abdul Ghany, the group’s founder and director. He oversees a volunteer corps of 35 mostly in Syria but also living in Turkey, Jordan, and Lebanon, where they have taken refuge.
SNHR’s data has been a key source for the UN High Commissioner for Human Rights and appears in US State Department reports on Syria. Monthly reports document recent death toll, assassinations, and attacks against civilians. In January there was information about the spread of COVID-19.
Other Resources that Can Help
ACLED’s Ten Conflicts to Worry About in 2021: Includes Myanmar, Belarus, Yemen, Ethiopia, India, and Pakistan. ACLED advises accessing data directly through the “export tool” and finding information about methodology under “Resource Library.” A video walks users through the data collection process.
The UCDP’s Conflict Encyclopedia: Describes itself as a “main provider of data on organized violence and the oldest ongoing data collection project for civil war, with a history of almost 40 years.” Offers a web-based system for visualizing, handling, and downloading data, including ready-made datasets on organized violence and peacemaking free of charge
Stockholm International Peace Research Institute Provides data on peace operations conducted since 2000, military expenditures, arms transfers, and embargoes.
George Mason University Libraries InfoGuides: Resources for research in conflict resolution, peace operations, armed conflict, and human security. Includes link for peace-building, human security, and terrorism datasets.
Amnesty International: Offers two free courses on Open Source Investigations in four languages, Arabic, Persian, English, and Spanish. Courses act as guides to using open source research methods in practice, with a focus on human rights investigation and advocacy. Instruction on cutting-edge tools and techniques taught by experts and practical exercises.
Global Terrorism Database, University of Maryland: Bills itself as the “most comprehensive unclassified database of terrorist attacks in the world.” Includes more than 200,000 terrorist attacks dating back to 1970.
WomanStats: A “comprehensive compilation of information on the status of women in the world.” It combs the extant literature and conducts interviews to find qualitative and quantitative information on over 310 indicators of women’s status in 174 countries.
Commission for International Justice and Accountability: Stated purpose, “Achieving justice for crimes that impact vulnerable populations across the globe, including war crimes, crimes against humanity, genocide, terrorism, human trafficking, and migrant smuggling.” Works to support prosecutions in 13 countries and assists 37 law enforcement and counterterrorism organizations globally.
This story was originally published on the DataJournalism.com website and is reproduced here with permission.